
What each tab does
Trade Log
One row per closed trade, with 1,000 rows ready. You fill in the yellow columns: date, symbol, market, side, quantity, multiplier, entry, stop, target, exit, fees, setup, a mistake tag and notes. The grey columns work out net P&L, risk in dollars, the R-multiple, planned reward-to-risk, a win or loss label, cumulative P&L and drawdown. Side is a drop-down (Long or Short), the header row has filters, and the first two columns stay visible when you scroll right.
Stats
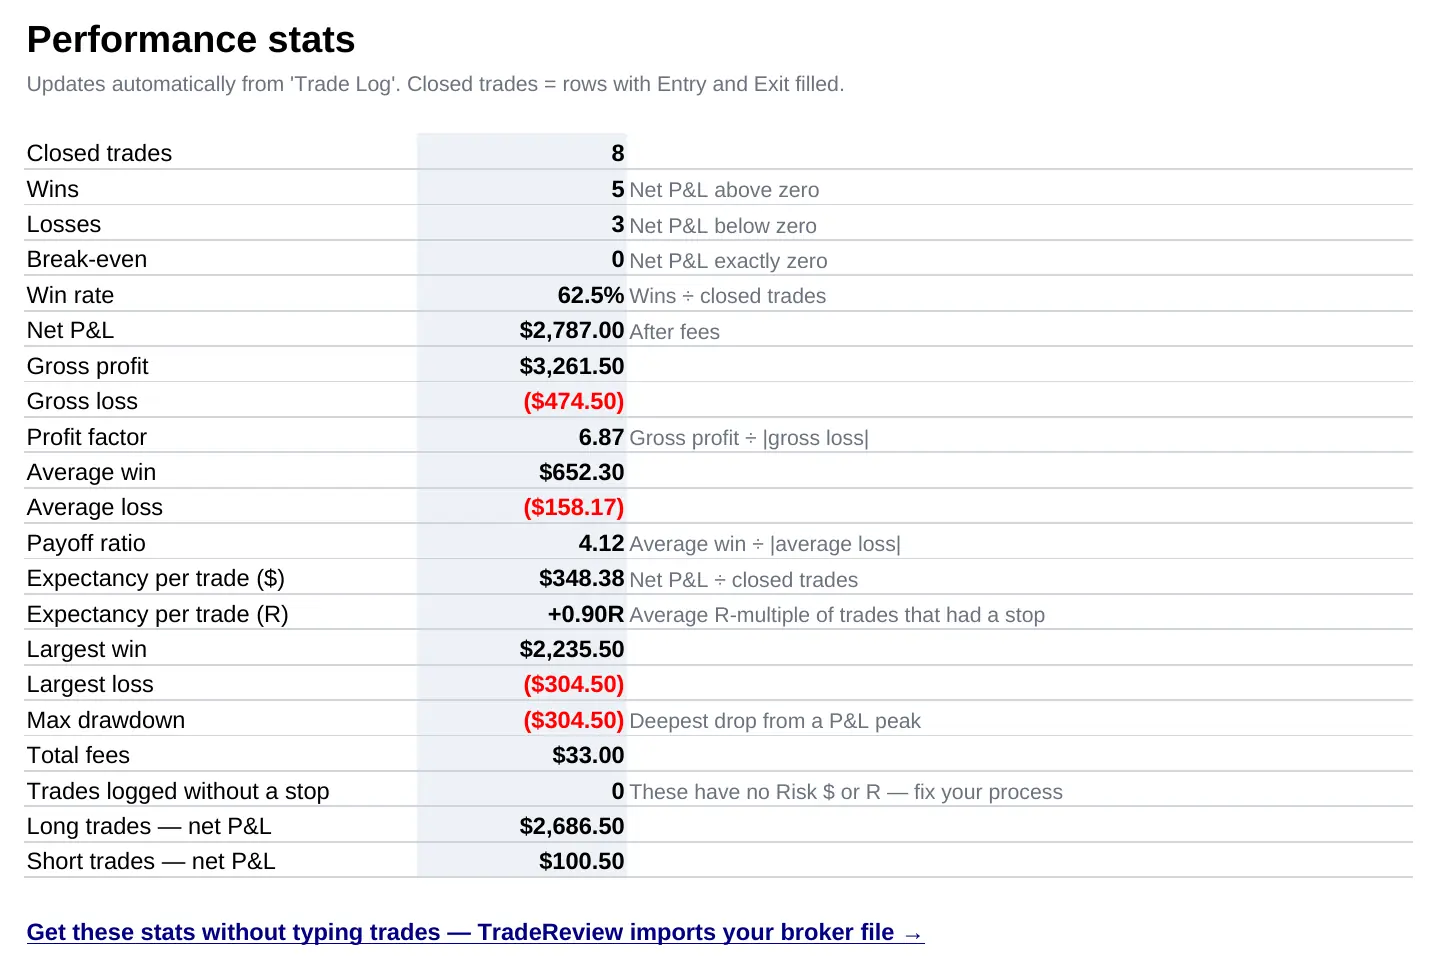
Twenty-one numbers that tell you whether your trading works: closed trades, wins and losses, win rate, net P&L, gross profit and loss, profit factor, average win and loss, payoff ratio, expectancy in dollars and in R, largest win and loss, max drawdown, total fees, long versus short P&L, and how many trades you logged without a stop. Most lines say how they are calculated.
By Setup
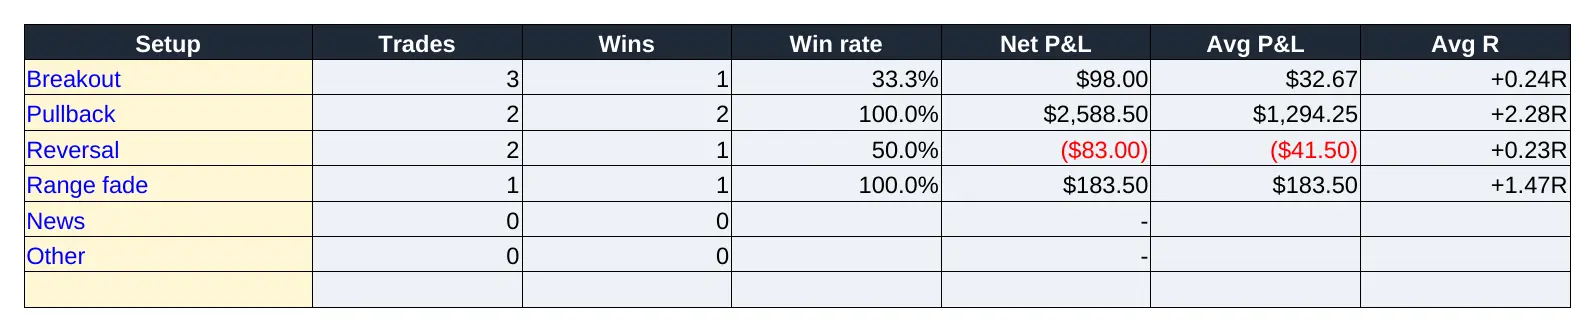
Trades, wins, win rate, net P&L, average P&L and average R for each setup. Edit the yellow setup names so they match exactly what you type in the Trade Log, and the rows fill in. This is the tab that tells you which setup to trade more and which to drop.
Monthly
Trades, win rate, net P&L and fees for twelve months, starting from the month of your first trade, plus a column chart of net P&L by month. For a second year, copy the last row down.
Set it up in three minutes
- Download and open the file. If Excel shows a "Protected View" bar, click Enable Editing.
- Clear the example trades. On the Trade Log, select cells A2 to N9 and press Delete. Clear only the yellow cells, not the rows, so the formulas stay in place.
- Rename the setups. On By Setup, replace Breakout, Pullback and the rest with the names you use.
- Log your next closed trade. Fill in the yellow cells, including the stop you planned before entering. The grey cells and every tab update straight away.
Excel tips that save time
- Filter by symbol or setup. Use the arrows in the header row. The Stats tab still counts every trade; filtering only changes what you see.
- Enter dates quickly.
Ctrl+;types today's date in Excel on Windows and Mac. - Futures, options and forex. Put the contract size in Multiplier: ES is 50, NQ is 20, options are 100, one standard forex lot is 100,000 with Qty in lots. See settings for your market.
- One file per year. It keeps the file fast and makes the yearly review easy. Save a copy on 1 January and clear the trades.
The exact formulas behind every column are on the home page, with a worked example you can check by hand.
Questions
Does the Excel trade journal template work on Mac and Excel for the web?
Yes. It only uses standard functions (IF, SUMIF, COUNTIF, SUMPRODUCT, AVERAGEIF, EDATE) that exist in Excel 2010 and later on Windows and Mac, and in Excel for the web. It also opens in LibreOffice and Numbers.
Can I add my own columns?
Yes. Insert new columns anywhere left of Net P&L (column O) and Excel updates the formulas for you. Keep the yellow input columns for things you type and leave the grey formula columns alone.
What happens after 1,000 trades?
The Stats, By Setup and Monthly tabs read rows 2 to 1,001 of the Trade Log. The simplest way past that is one file per year: save a copy, clear the trades and keep going.
Why are my stats blank?
A trade only counts once Entry and Exit are both filled in. Trades without a stop still count for P&L and win rate but have no Risk $ or R-multiple; the Stats tab shows how many of those you have.