What's on each page
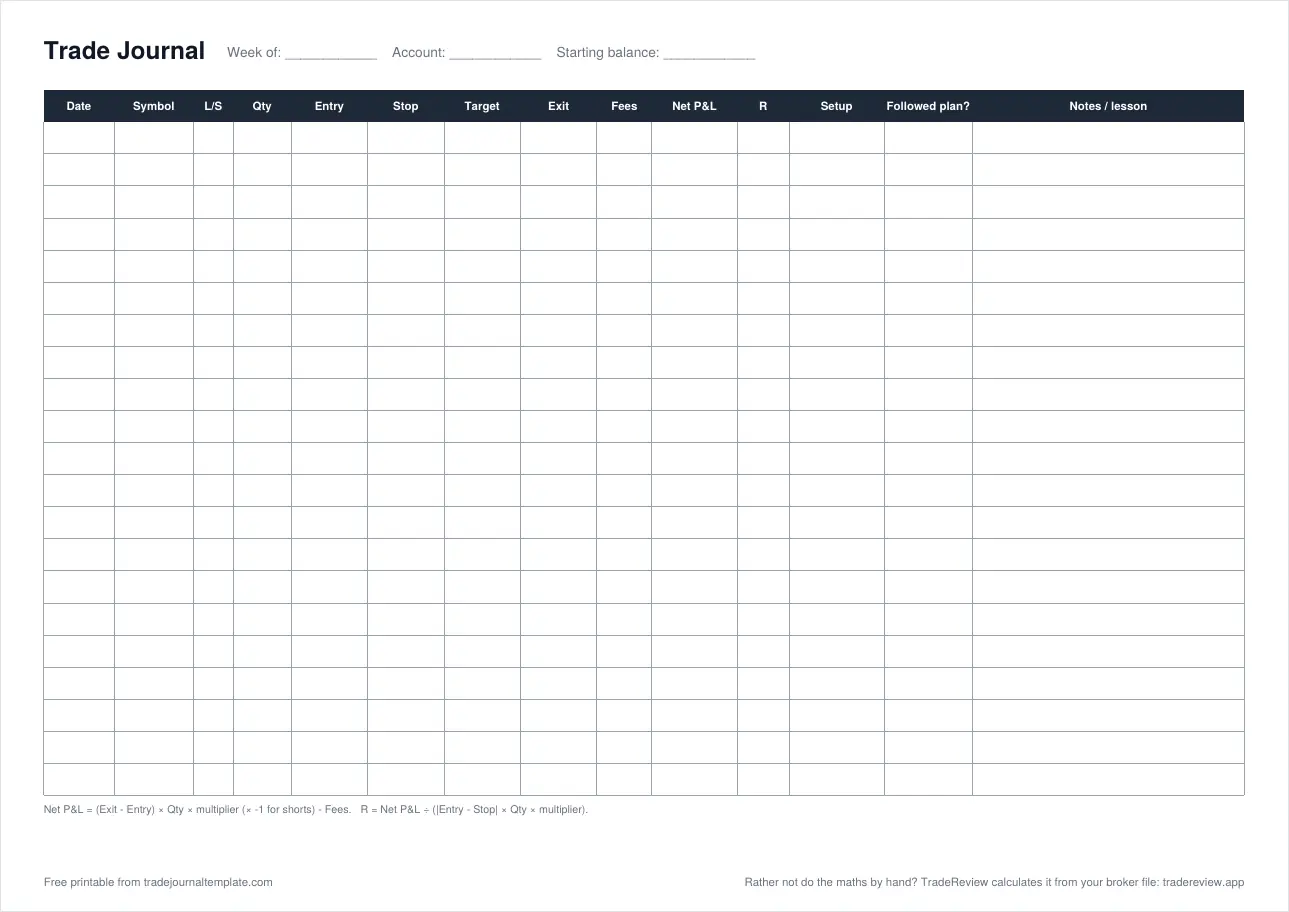
Page 1: trade log
One row per trade with columns for date, symbol, long or short, quantity, entry, stop, target, exit, fees, net P&L, R, setup, whether you followed your plan, and a note or lesson. The top line has space for the week, the account and the starting balance. The P&L and R formulas are printed along the bottom so you can work them out on the spot.
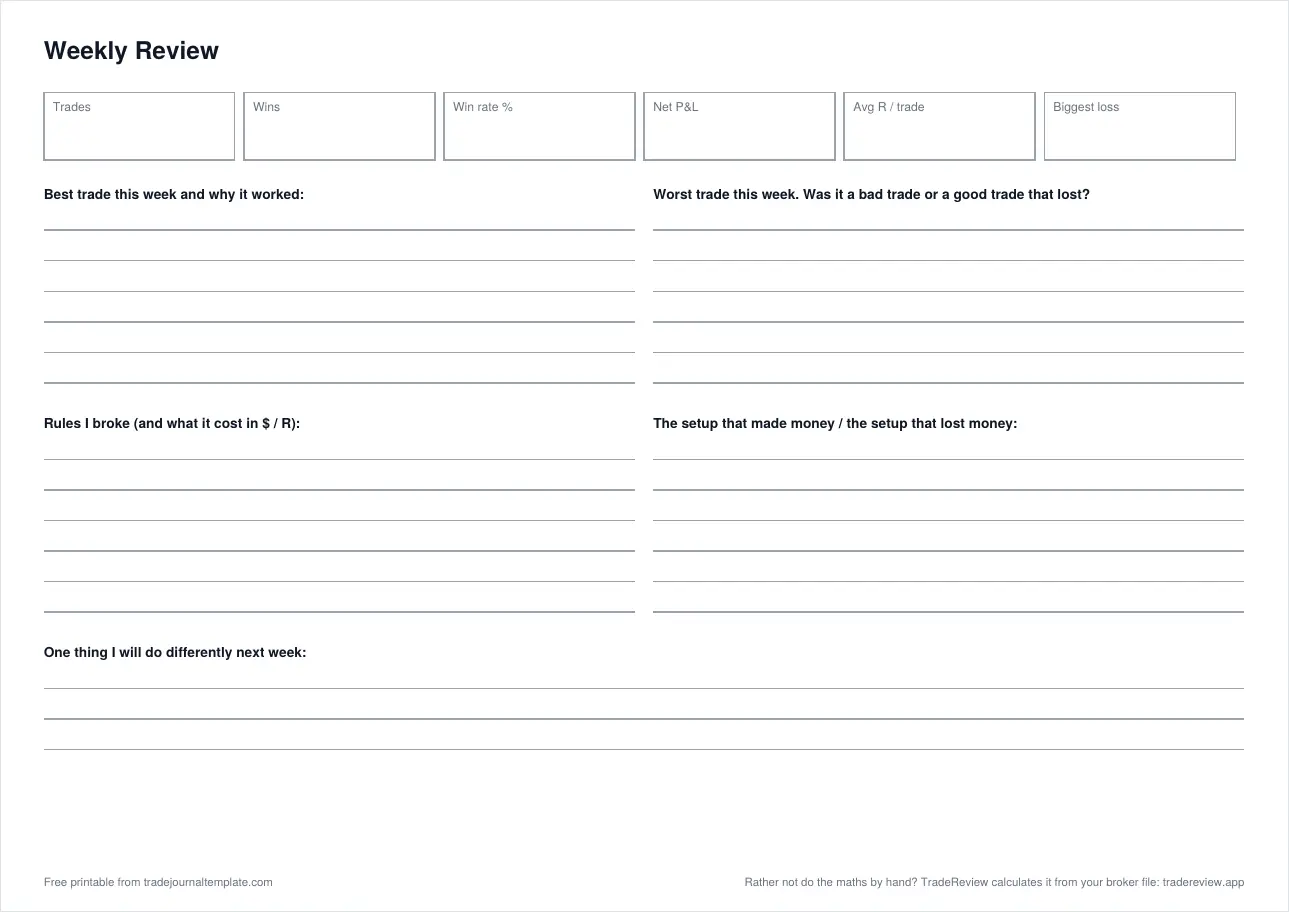
Page 2: weekly review
Boxes for the week's trades, wins, win rate, net P&L, average R per trade and biggest loss, then five prompts: your best trade and why it worked, your worst trade and whether it was a bad trade or a good trade that lost, the rules you broke and what they cost, the setups that made and lost money, and one thing to change next week.
How to print it
- Orientation: landscape. Most PDF viewers pick this automatically.
- Scale: choose Fit to page (or "Fit to printable area") so the outer columns aren't cut off.
- Double-sided: print the log on the front and the review on the back, and you have one sheet per week.
- A binder works best: hole-punch each week's sheet so the whole year stays in order for your review.
When paper is the right choice
Writing a trade down by hand makes you slow down, and a sheet next to your keyboard stays in view while you trade. Paper is a good fit if you take a few trades a day, trade one market, or want a pre-market routine away from the screen.
It gets harder once you need numbers across weeks: win rate by setup, expectancy over three months, the effect of one bad habit. A practical routine is to log on paper during the day and copy the week's trades into the Excel or Google Sheets template on Friday, or straight into the online journal.
Questions
How many trades fit on one page?
About 20: the A4 version has 21 rows and the US Letter version has 22. Print as many log pages as you need and one review page per week.
Can I fill in the PDF on an iPad or tablet?
Yes. Open it in a note-taking app that lets you write on PDFs, such as GoodNotes, Notability or the built-in Markup tool on iPhone and iPad, and duplicate the log page as it fills up.
How do I work out net P&L and R by hand?
The formulas are printed at the bottom of the log page: Net P&L = (Exit − Entry) × Qty × multiplier, flipped for shorts, minus fees. R = Net P&L ÷ (|Entry − Stop| × Qty × multiplier).